What are driving factors behind the gas price? With freely accessible data we are goging to find out if the brand, the location and more have any impact on the price!

What are driving factors behind the gas price? With freely accessible data we are goging to find out if the brand, the location and more have any impact on the price!

Vom 09.-10. Oktober präsentieren wir von STATWORX gemeinsam mit BARC die Data University an der Goethe-Uni in Frankfurt. 2 Tage lang werden wir dort unser geballtes Data Science Wissen in praxisorientierten Workshops an die Teilnehmenden weitergeben. In zwei besonders spannenden Workshops von unserem Kollegen David dreht sich am zweiten Schulungstag alles um das R Paket Shiny. Vormittags wird es eine …
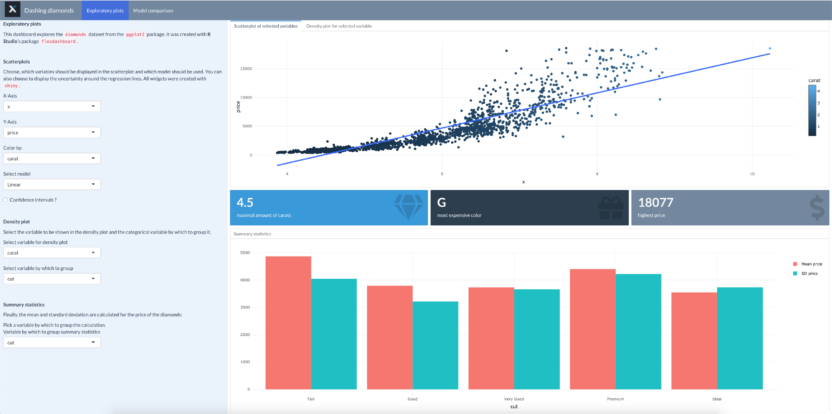
In this blog article, you will learn you how to set up a dashboard with the flexdashboard package, how to integrate interactive widgets and how to deploy the app on shinyapps.io.

Never heard of non-standard evaluation? Then our colleague Markus has the perfect answer for you: Bang Bang! In this blog post, Markus introduces meta-programming when using dplyr.

Monotoniebedingungen können helfen den Sachverhalt besser durch Modelle darstellen zu lassen. In diesem Beitrag wird erklärt wir man solche Monotoniebedingungen in R umsetzt.
It is June and nearly half of the year is over, marking the middle between Christmas 2018 and 2019. Last year in autumn, I’ve published a blog post about predicting Wham’s „Last Christmas“ search volume using Google Trends data with different types of neural network architectures. Of course, now I want to know how good the predictions were, compared to …

In my last blog post, I have elaborated on the Bagging algorithm and showed its prediction performance via simulation. Here, I want to go into the details on how to simulate the bias and variance of a nonparametric regression fitting method using R. These kinds of questions arise here at STATWORX when developing, for example, new machine learning algorithms or …

Do you want to optimise your code but don’t know where to start? In this post I guide you through my thought process when I optimised my code.

A walk through how networks are visualized at STATWORX using the package visNetwork.

In our series of explaining method in 100 lines of code, we tackle random forest this time! We build it from scratch and explore it’s functions.