Do you want to visualize beautiful graphs in R but are shy to leave the tidyverse? Tidygraph and Ggraph ‚got you covered! See how their main functionalities are applied in this social network example!

Do you want to visualize beautiful graphs in R but are shy to leave the tidyverse? Tidygraph and Ggraph ‚got you covered! See how their main functionalities are applied in this social network example!
The number of different products and customers in any business area are practically infinite.
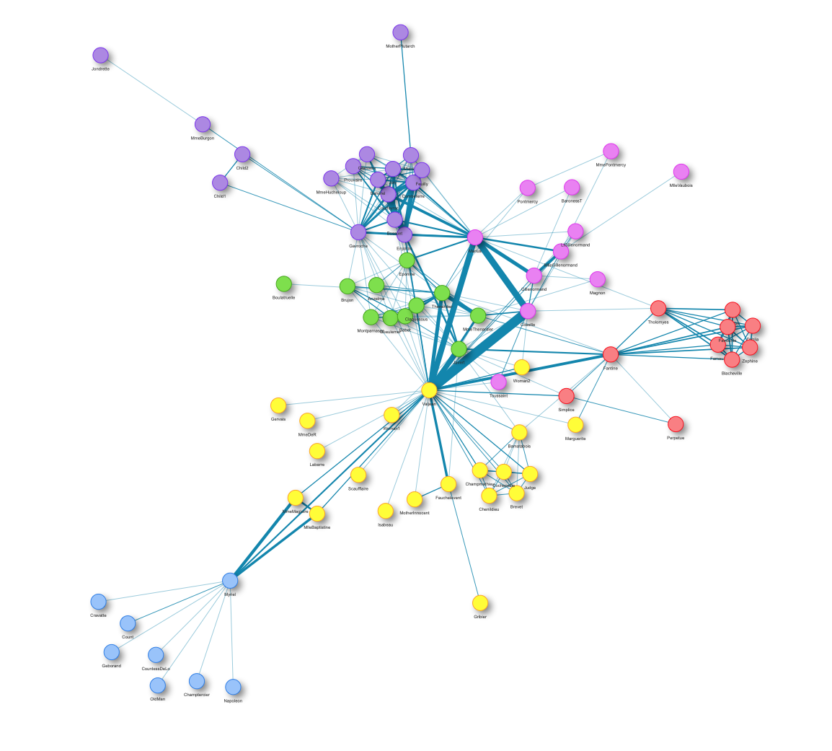
But how can you find interactions between them like joint purchases and define groups? One solution is the so-called Community Detection. In this blog post, I want to show you the magic behind Community Detection and give you a theoretical introduction into the Louvain and Infomap algorithm.
A walk through how networks are visualized at STATWORX using the package visNetwork.