Die Codebase deines Data Science-Projekts wächst und wächst, und du drohst den Überblick zu verlieren? Dann kann dieses Tool vielleicht Abhilfe schaffen! Felix Plagge hat ein Paket geschrieben, das einen Call Graph für ein beliebiges Python-Skript erstellt. In diesem Artikel erklärt er zunächst, wozu Projektgrafiken nützlich sind und erklärt anschließend die Installation und Verwendung seines Pakets namens project_graph.
STATWORX Cheatsheets – Python Basics Cheatsheet für Data Science
Du willst Python lernen? Oder brauchst du von Zeit zu Zeit eine kleine Gedächtnisstütze beim Programmieren? Genau dafür wurden Cheatsheets erfunden! Unser erstes Cheatsheet mit den Grundlagen von Python ist der Start einer neuen Blog-Serie, in der weitere Cheatsheets in unserem einzigartigen STATWORX Stil folgen werden.
How to Build a Machine Learning API with Python and Flask
In this blog post, Jannik will show you how to deploy your machine learning models as a REST API and how to make requests to the API from within your Python code.
Airflow for Data Scientists
As data scientists, getting our hands on the data we need is often the most challenging part of a project. In practice, we tend to make life hard on ourselves because we don’t use the best tools for the job. Well no longer! Read on to learn how can you can harness Airflow to orchestrate your own ETL processes like a pro!
Permafrost Hackathon – Unsupervised Movement Detection
Have a look at what my team and I worked on during the Permafrost Hackathon in Zurich. The goal was to detect movements from multitemporal images. Since the images didn’t have any labels, we used unsupervised learning methods. Check it out, yo!
Making Of: A Free API For COVID-19 Data
For all those, who are struggling with the (kind of weird) Johns Hopkins University COVID-19 case data CSV files, we’ve created a free API that makes it easy to integrate the latest worldwide COVID-19 data into your application.
How To Build A Dashboard In Python – Plotly Dash Step-by-Step Tutorial
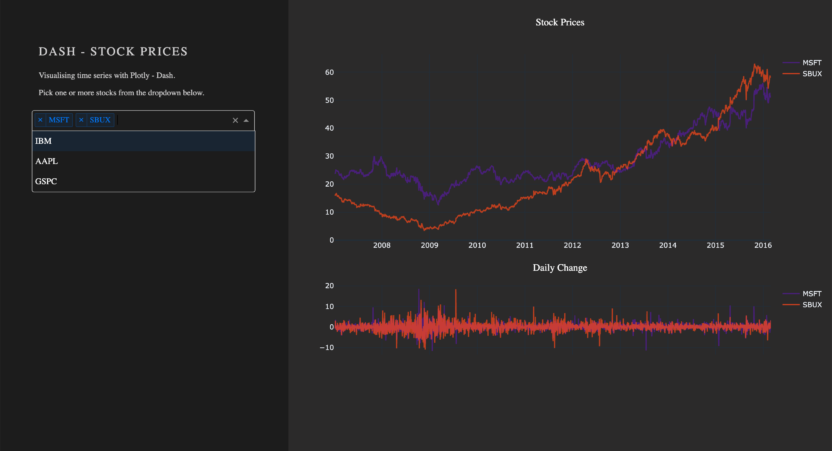
This blog is a hands-on experience in Dash, presenting core components, how to display figures with callbacks, supplying you with a working web application to play with, and the resources to build your own. Dash is a powerful tool for Python developers. Developed by the team behind Plotly, Dash is an open-source framework built on top of Flask, Plotly.js, and React.js.
Access your Spark Cluster from Everywhere with Apache Livy
As a REST API, Livy provides Spark interaction without any need of a Spark configuration on your client. Once being able to communicate with the API Spark code can be submitted from everywhere.
What’s cooking at STATWORX?
Besides working hard to provide our clients with cutting-edge Machine Learning solutions, we are also big fans of all things culinary here at STATWORX. But can we apply some of those algorithms to make us better cooks? This blog article explores the unlikely union of Data Science and baking!
Web Scraping 101 in Python with Requests & BeautifulSoup
Want to obtain a specific dataset from a website which does not have an API? In this post, I explain how to do this by scraping data using Python, how you determine whether it is allowed to scrape a specific page and more.

