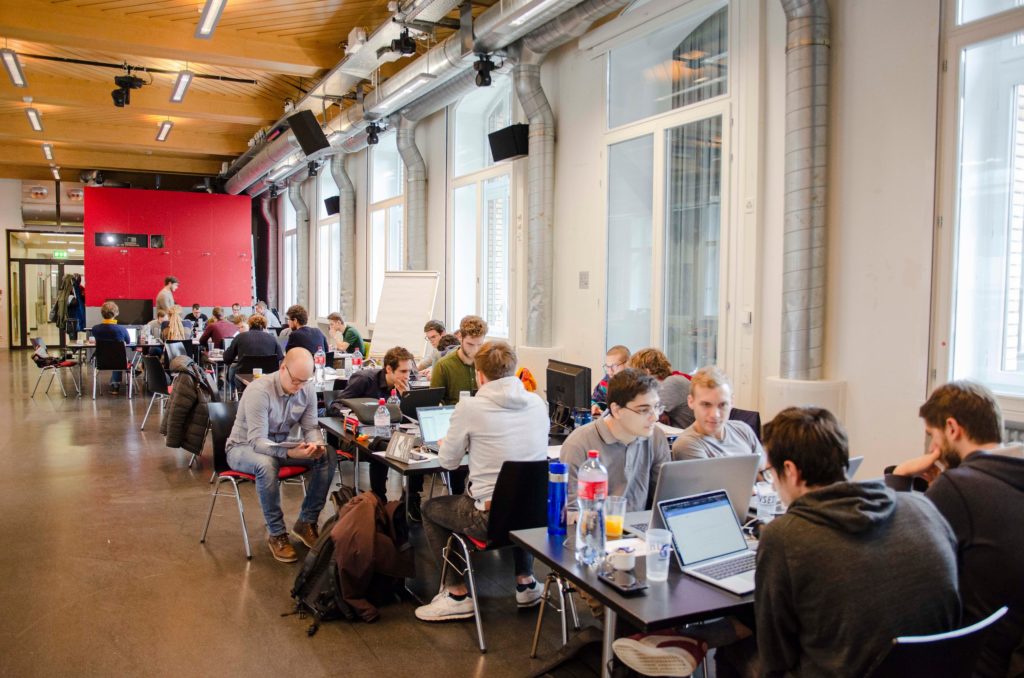
I love riddles and all the problems that I encounter as a STATWORX data scientist I perceive as riddles. There are times, where my urge for riddles is so strong that I participate in hackathons to satisfy it. Hackathons are events, where people with different backgrounds meet and work on a specific challenge for a limited time. In this blog post, I will present my impressions and results from the Permafrost Hackathon, that took place at the ETH Zurich end of November 2019.
Here is an Overview
The hackathon organizers are part of the PermaSense project, where researchers from geospatial to engineering disciplines work together. The objective is to gather data in high quality from steep bedrock permafrost in an Alpine environment on the Hörnli ridge of the Matterhorn, an iconic Swiss Mountain.
The data is obtained using a network of wireless sensors, which record among other things temperature, wind speed, and seismic activity. Below is an illustration of different sensor setups, which measure temperature and fracture resistance in rocks.
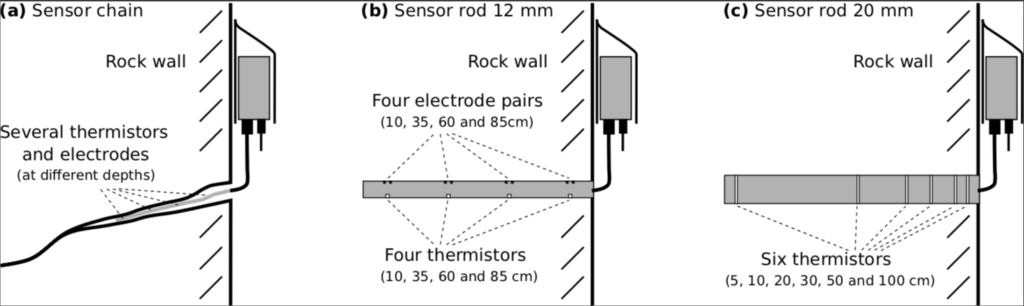
Furthermore, a picture of the mountain wall, where the sensors are installed, is taken every four minutes. For more information about the PermaSense project check out this link. All the data is open-source and can be found here.
The objective of the hackathon was to find new ideas and ways to utilize this data – which is where the creativity of the hackathon participants comes into play.
Let’s dive into it
The teams were build randomly over delicious finger food and few beers. My team – Team Aroma (named after a famous falafel place in Frankfurt) – consisted of Emma, Luca, Tiziano, Lisa (honorary member), and myself. All of us came from different areas. We covered the fields of Computer Science, Electrical Engineering (Signal Processing), Predictive Forecasting, and Physics.
The initial idea of my team was to build some kind of data exploration engine, which incorporates the different data sources at the same time to get a better understanding and overview of the data. However, once we started with the project we focused much more on the images than the other sources and came up with two interesting approaches.
Our approaches had the same goal – to detect mountaineers. But the images did not have labels, therefore, we could not turn to supervised learning methods. Alternatively, we came up with some other ways to detect, whether there are mountaineers on a certain image using unsupervised methods.
One approach based on the fact that mountaineers wear colorful jackets. Hence, we created color filters for three different colors (red, yellow, and blue). The color filter worked surprisingly well but was quite prone to noise. E.g. during summer the red color filter has a hard time to distinguish rocks and mountaineers since some rocks are kind of reddish.
The second approach – which is the focus of this blogpost – used the idea of subtracting sequential images. This results in a so-called difference image, where changes between the images are highlighted. Formally, this is depicted in the equation below.
![\[ IMG_{diff} = |IMG_1 - IMG_2|\]](https://wordpress-112839-321398.cloudwaysapps.com/wp-content/ql-cache/quicklatex.com-6b9ce4c2a661fafa2802cb9c8e47d09f_l3.png "Rendered by QuickLaTeX.com")
This works just in special cases, e.g. where the picture depicts the same landscape.
Detecting Mountaineers
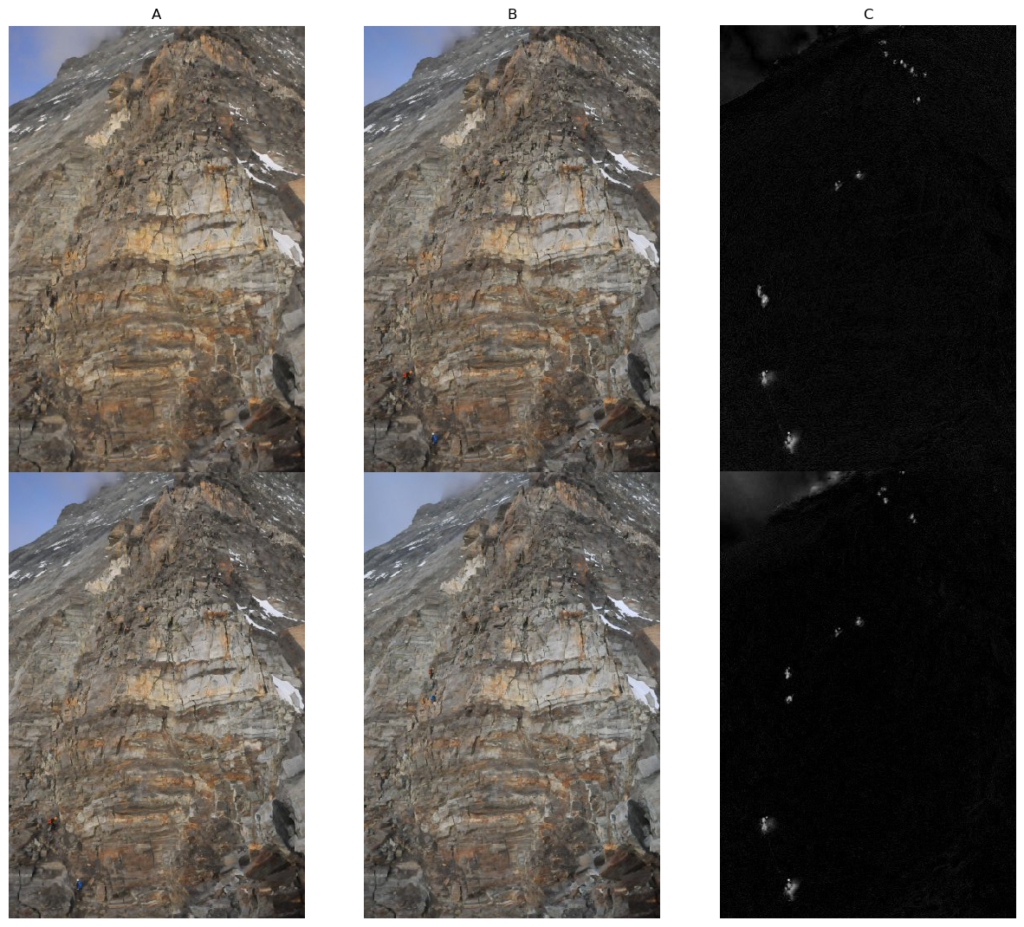
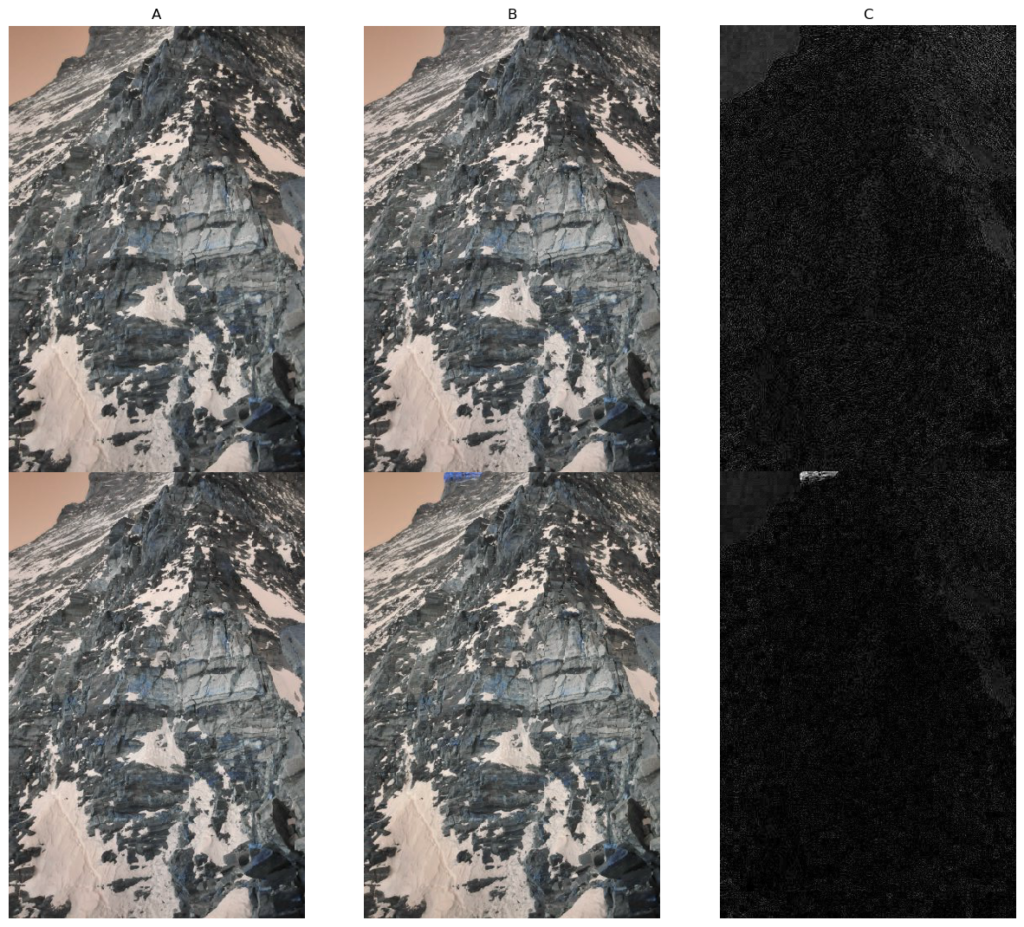
Below you can see some images of the mentioned mountain wall. Although, tough to spot, but there are some mountaineers in action. Now, images A and B are shown in color. Image C is the difference image of A and B (before subtraction the images are transformed into greyscale). Image A in the first row was taken at 04:32 in the morning, image B in the first row at 04:36 – in four minute intervals pictures are taken of the mountain wall. Similarly, in the second row image A is the same as image B in the first row (04:36), whereas image B in the second row was taken at 04:40.
Keep in mind that greyscale images are just matrices with numbers signaling the intensity of brightness. The values are integers from 0 to 255, where zero represents complete darkness and the highest value of brightness depicts the color white. Hence, if two identical images are subtracted the difference image will be completely black – since the resulting matrix is populated just with zeros. But if the images are similar with just small differences, e.g. on one image there is a mountaineer and on the other, the mountaineer is gone, then the location of the change will be highlighted in white on the difference image.
That’s a nice way to spot changes, right? However, changes that we are not particularly interested in, are highlighted as well, especially, changes in light. When sunshine falls slightly different than in the previous picture it results in noise in the difference image. Noise can be identified by the white sprinkle and is also called salt noise.
Changes like the sunrise (shown in figure 2) have a greater impact and will, thus, be highlighted when using our approach.
After the initial successes with the difference image approach, we tackled the issues described above. Luckily, we found a paper of Turgay Celik [1]. He presents an approach to detect changes in satellite images using unsupervised learning methods, where the starting point is the difference image as well. I won’t dive into the technical details in this blog post – but I will present to you the results from our implementation. If you are curious, visit my github repo for the code or check out the paper. We implemented our movement detection in Python.
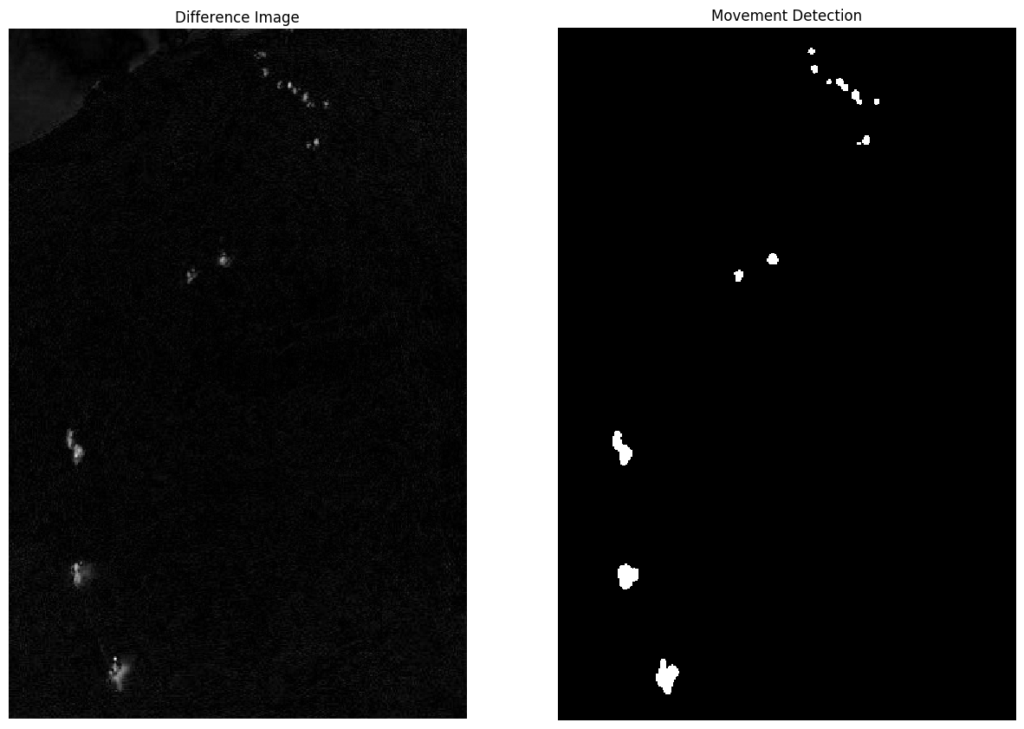
In the left panel of the figure above the difference image from the first example is depicted. The right panel shows the movement detection, which is based on the difference image. The salt noise is gone and the movement of the mountaineers is correctly identified. Note that the cloud movement in the upper left corner of the left panel is not highlighted in the right panel. These changes are not significant enough compared to the movements of the mountaineers. This is a great example where the movement detection technique works.
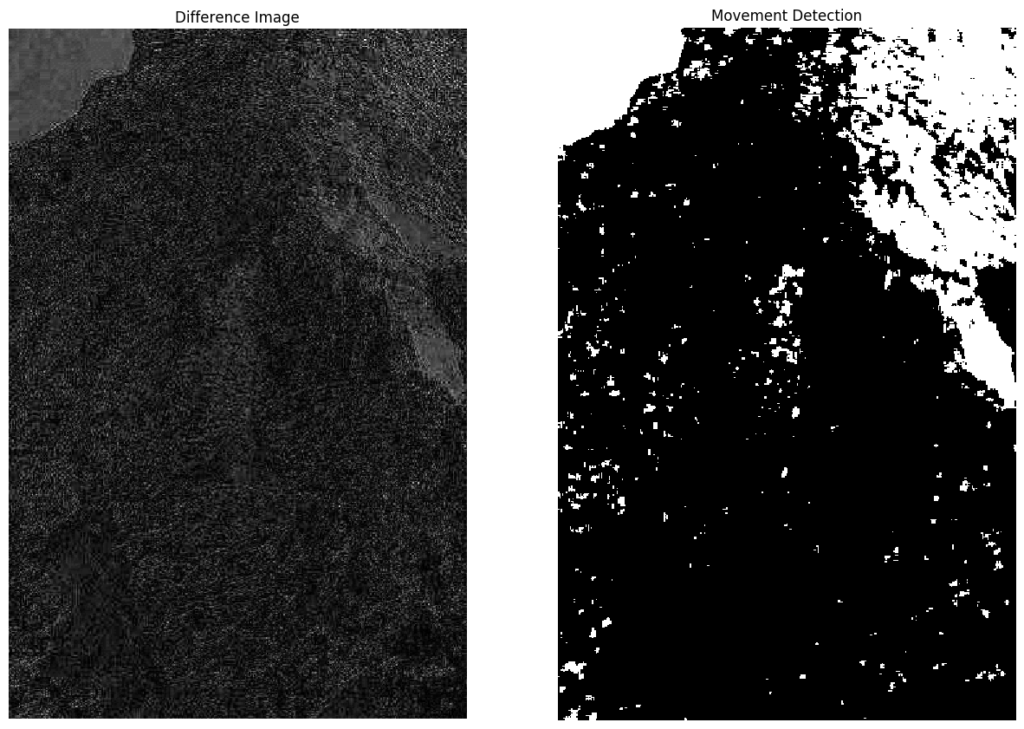
However, the example below shows a case where the movement detection fails. Particularly, there are no significant movements. But areas, where the light changed a bit, are classified as changes.
Refinements
The hackathon is over and we didn’t further work on our project. But there is plenty of room for improvement. As shown the implementation works, however, it is still too sensitive to noise. To develop a better system is a research question in itself. Personally, I think comparing the difference images might be a good starting point. Clustering them into images with changes and images without might already help (e.g. using tSNE). The system would then run just on those cases, where there were changes.
Roundup
I am glad I attended the Permafrost hackathon and got to work on some ideas with my team. The mentioned technique is very interesting and according to the organizers, they will invest and further develop this approach. In May there will be a field trip with all interested participants to the Hörnli ridge with a presentation of new results stemming from the hackathon.
Each team presented what they were working on during the hackathon. It was amazing to see all the different results. One team created a sleek looking application which the mountaineers could use to get real-time information about the weather including a one day forecast. Another team focused on predicting seismic activity and the likelihood of a rockfall. Thus, there were many great ideas for utilizing the data.
That’s it from me. I hope you find the topic as interesting as I do. If there are any questions or remarks you are welcome to shoot me an email.
References
Über den Autor
ABOUT US
STATWORX
is a consulting company for data science, statistics, machine learning and artificial intelligence located in Frankfurt, Zurich and Vienna. Sign up for our NEWSLETTER and receive reads and treats from the world of data science and AI. If you have questions or suggestions, please write us an e-mail addressed to blog(at)statworx.com.