The first time we at STATWORX are opening our doors for anyone who wants to learn more about data.
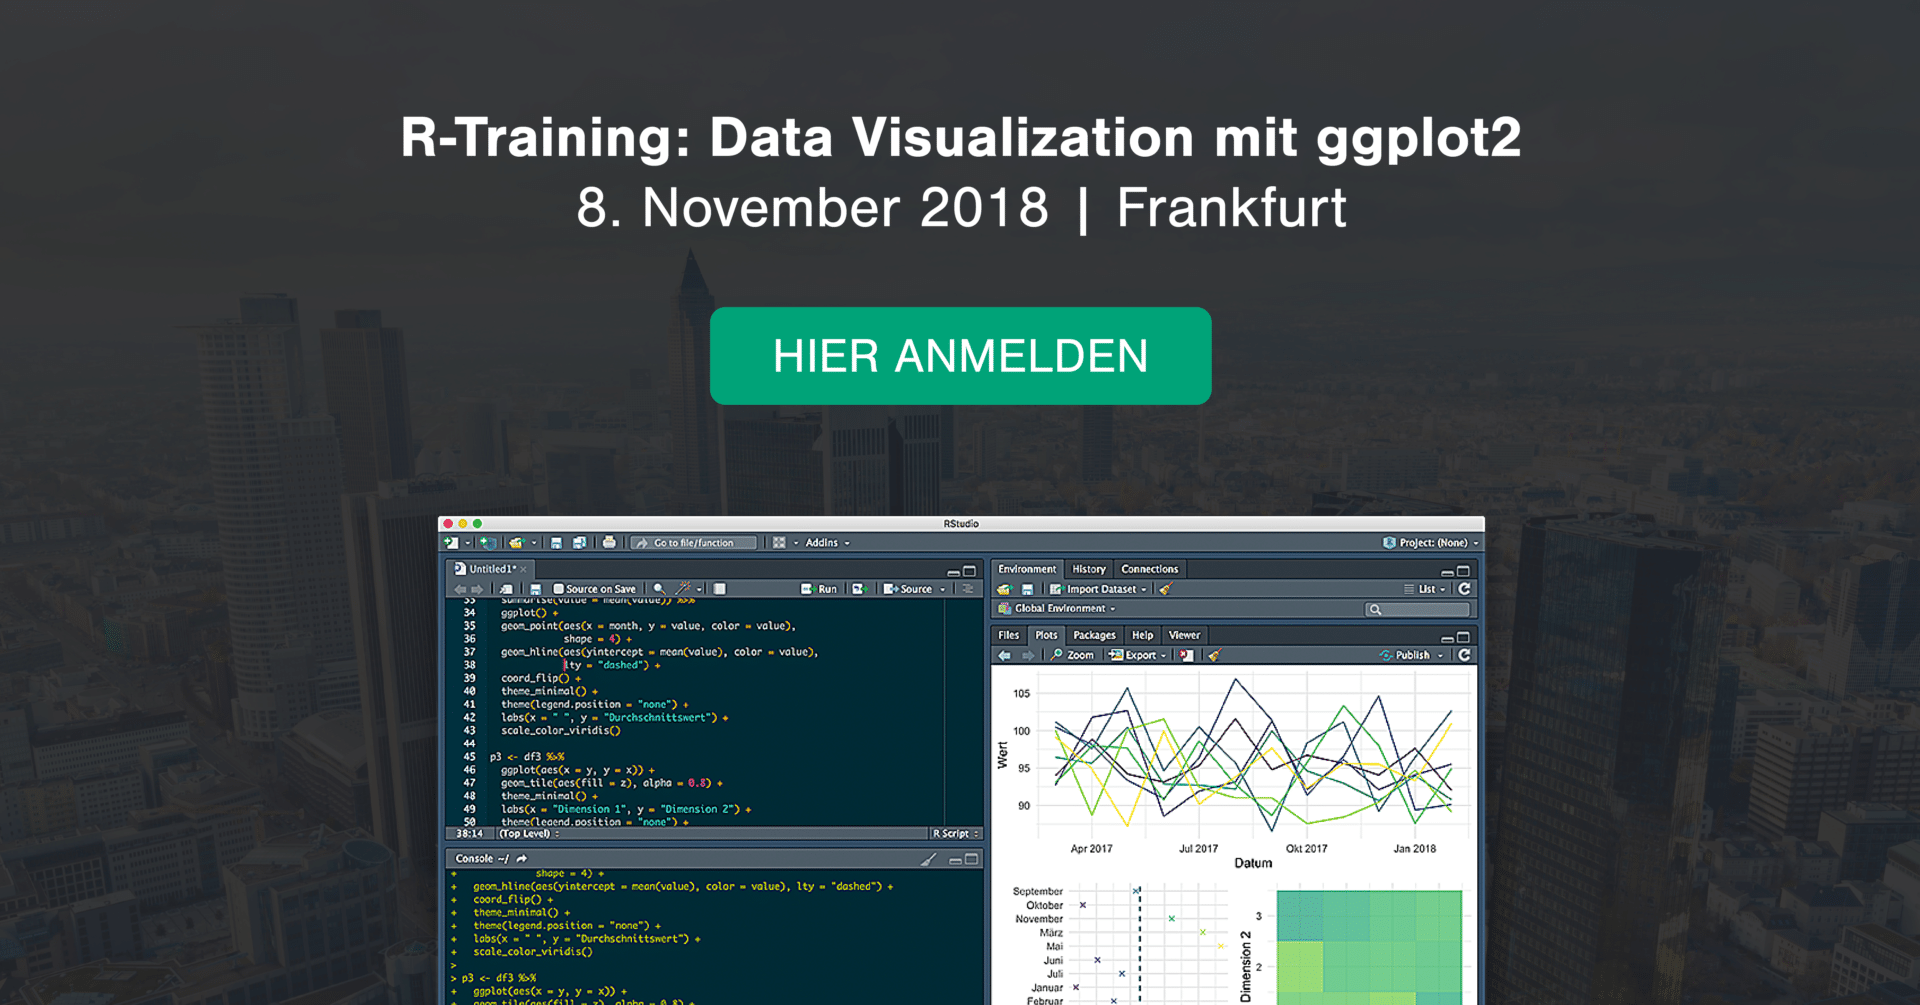
Our “Data Visualization in R and ggplot2” workshop is designed for R-beginners and provides the perfect mixture between theory and practice. The workshop will be held in german at our office in Frankfurt.
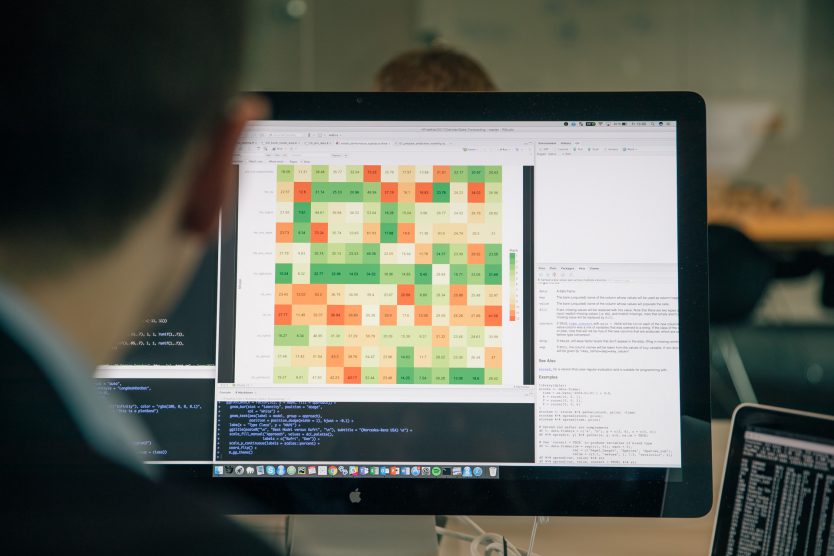
Participants achieve first insights into the concepts of data visualization in R and the famous ggplot2 package.
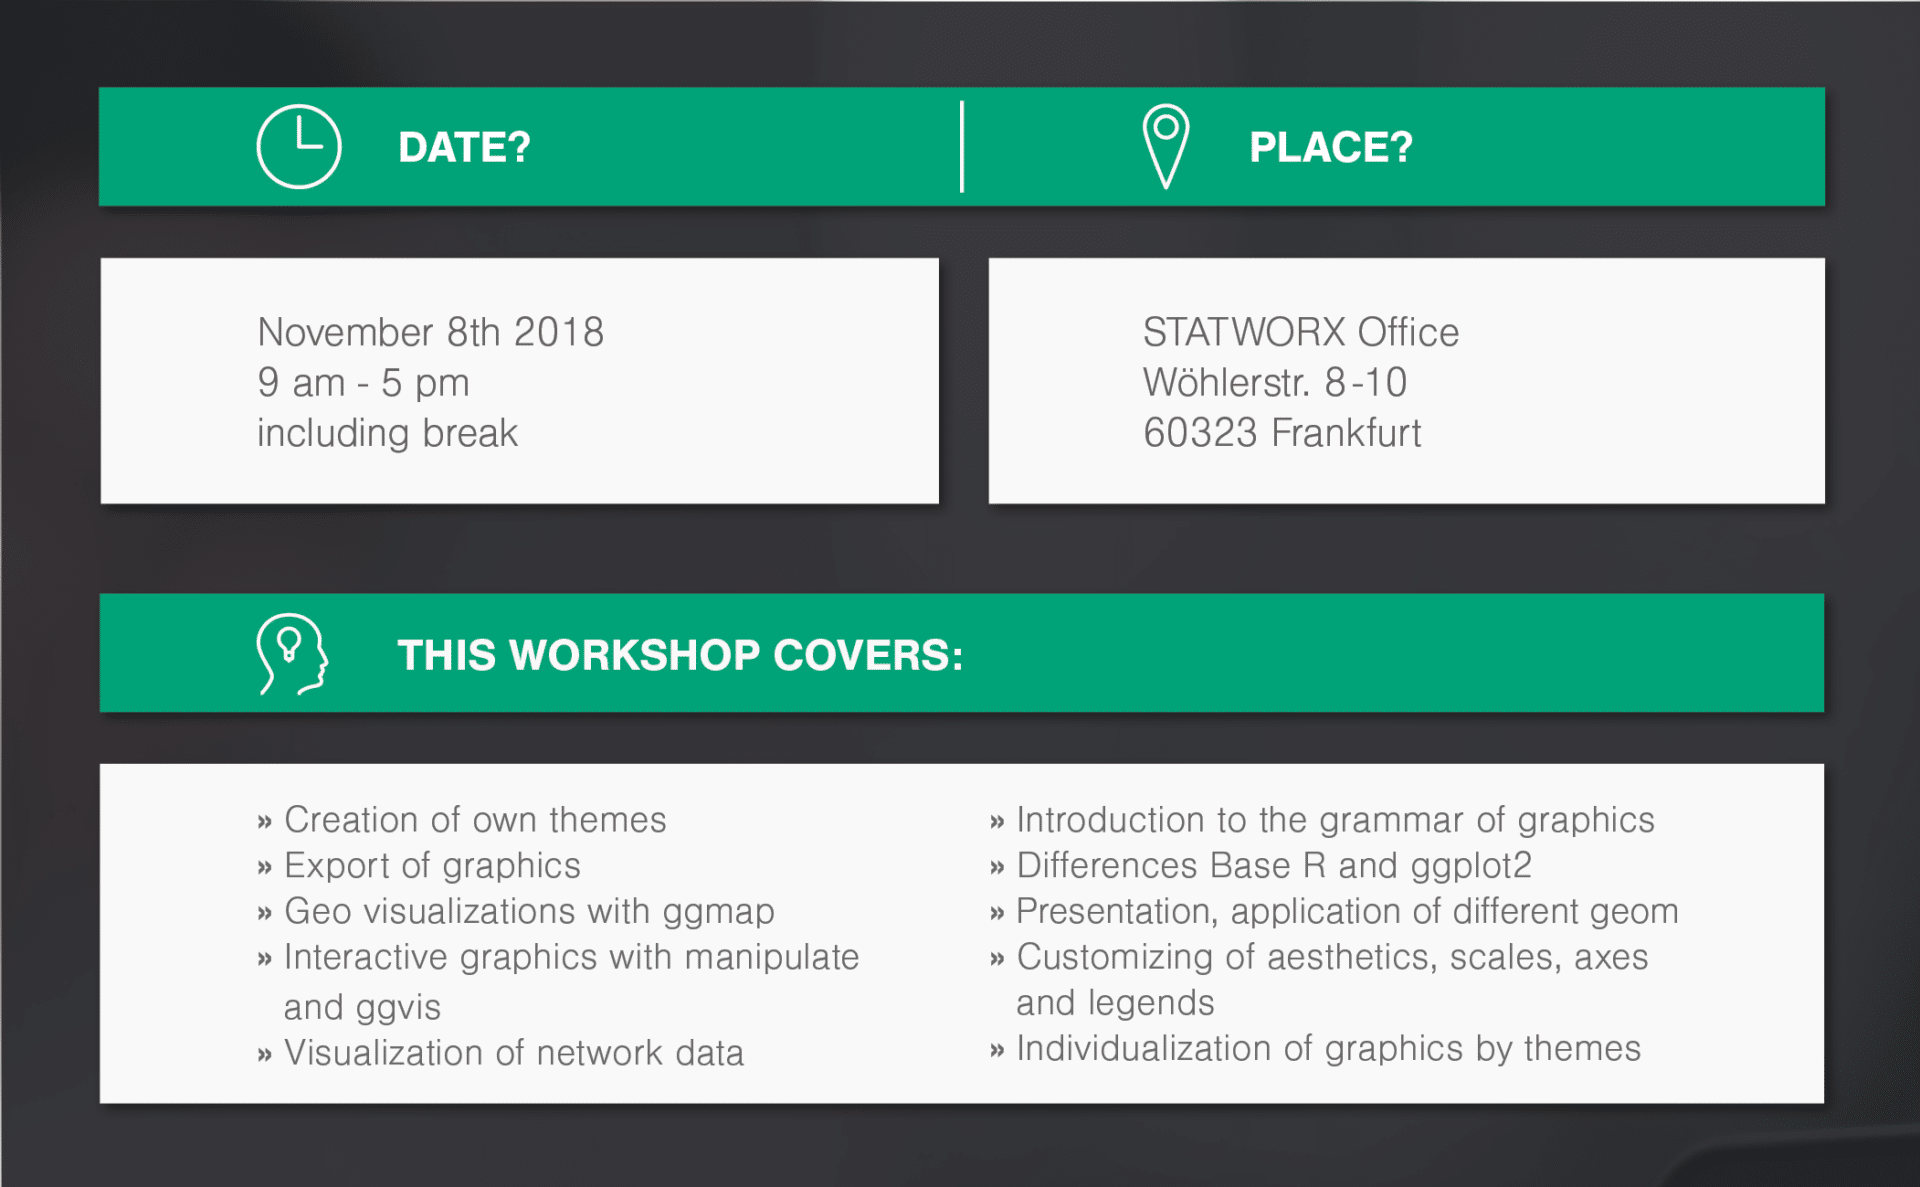
There is a limit of 8 persons per workshop to respond to every participant in the best possible way.
If you want to read more about Data Visualization check out the blog post of our trainer Lea Waniek.
Über den Autor
ABOUT US
STATWORX
is a consulting company for data science, statistics, machine learning and artificial intelligence located in Frankfurt, Zurich and Vienna. Sign up for our NEWSLETTER and receive reads and treats from the world of data science and AI. If you have questions or suggestions, please write us an e-mail addressed to blog(at)statworx.com.